Northeast salary and recruitment information across Specialties
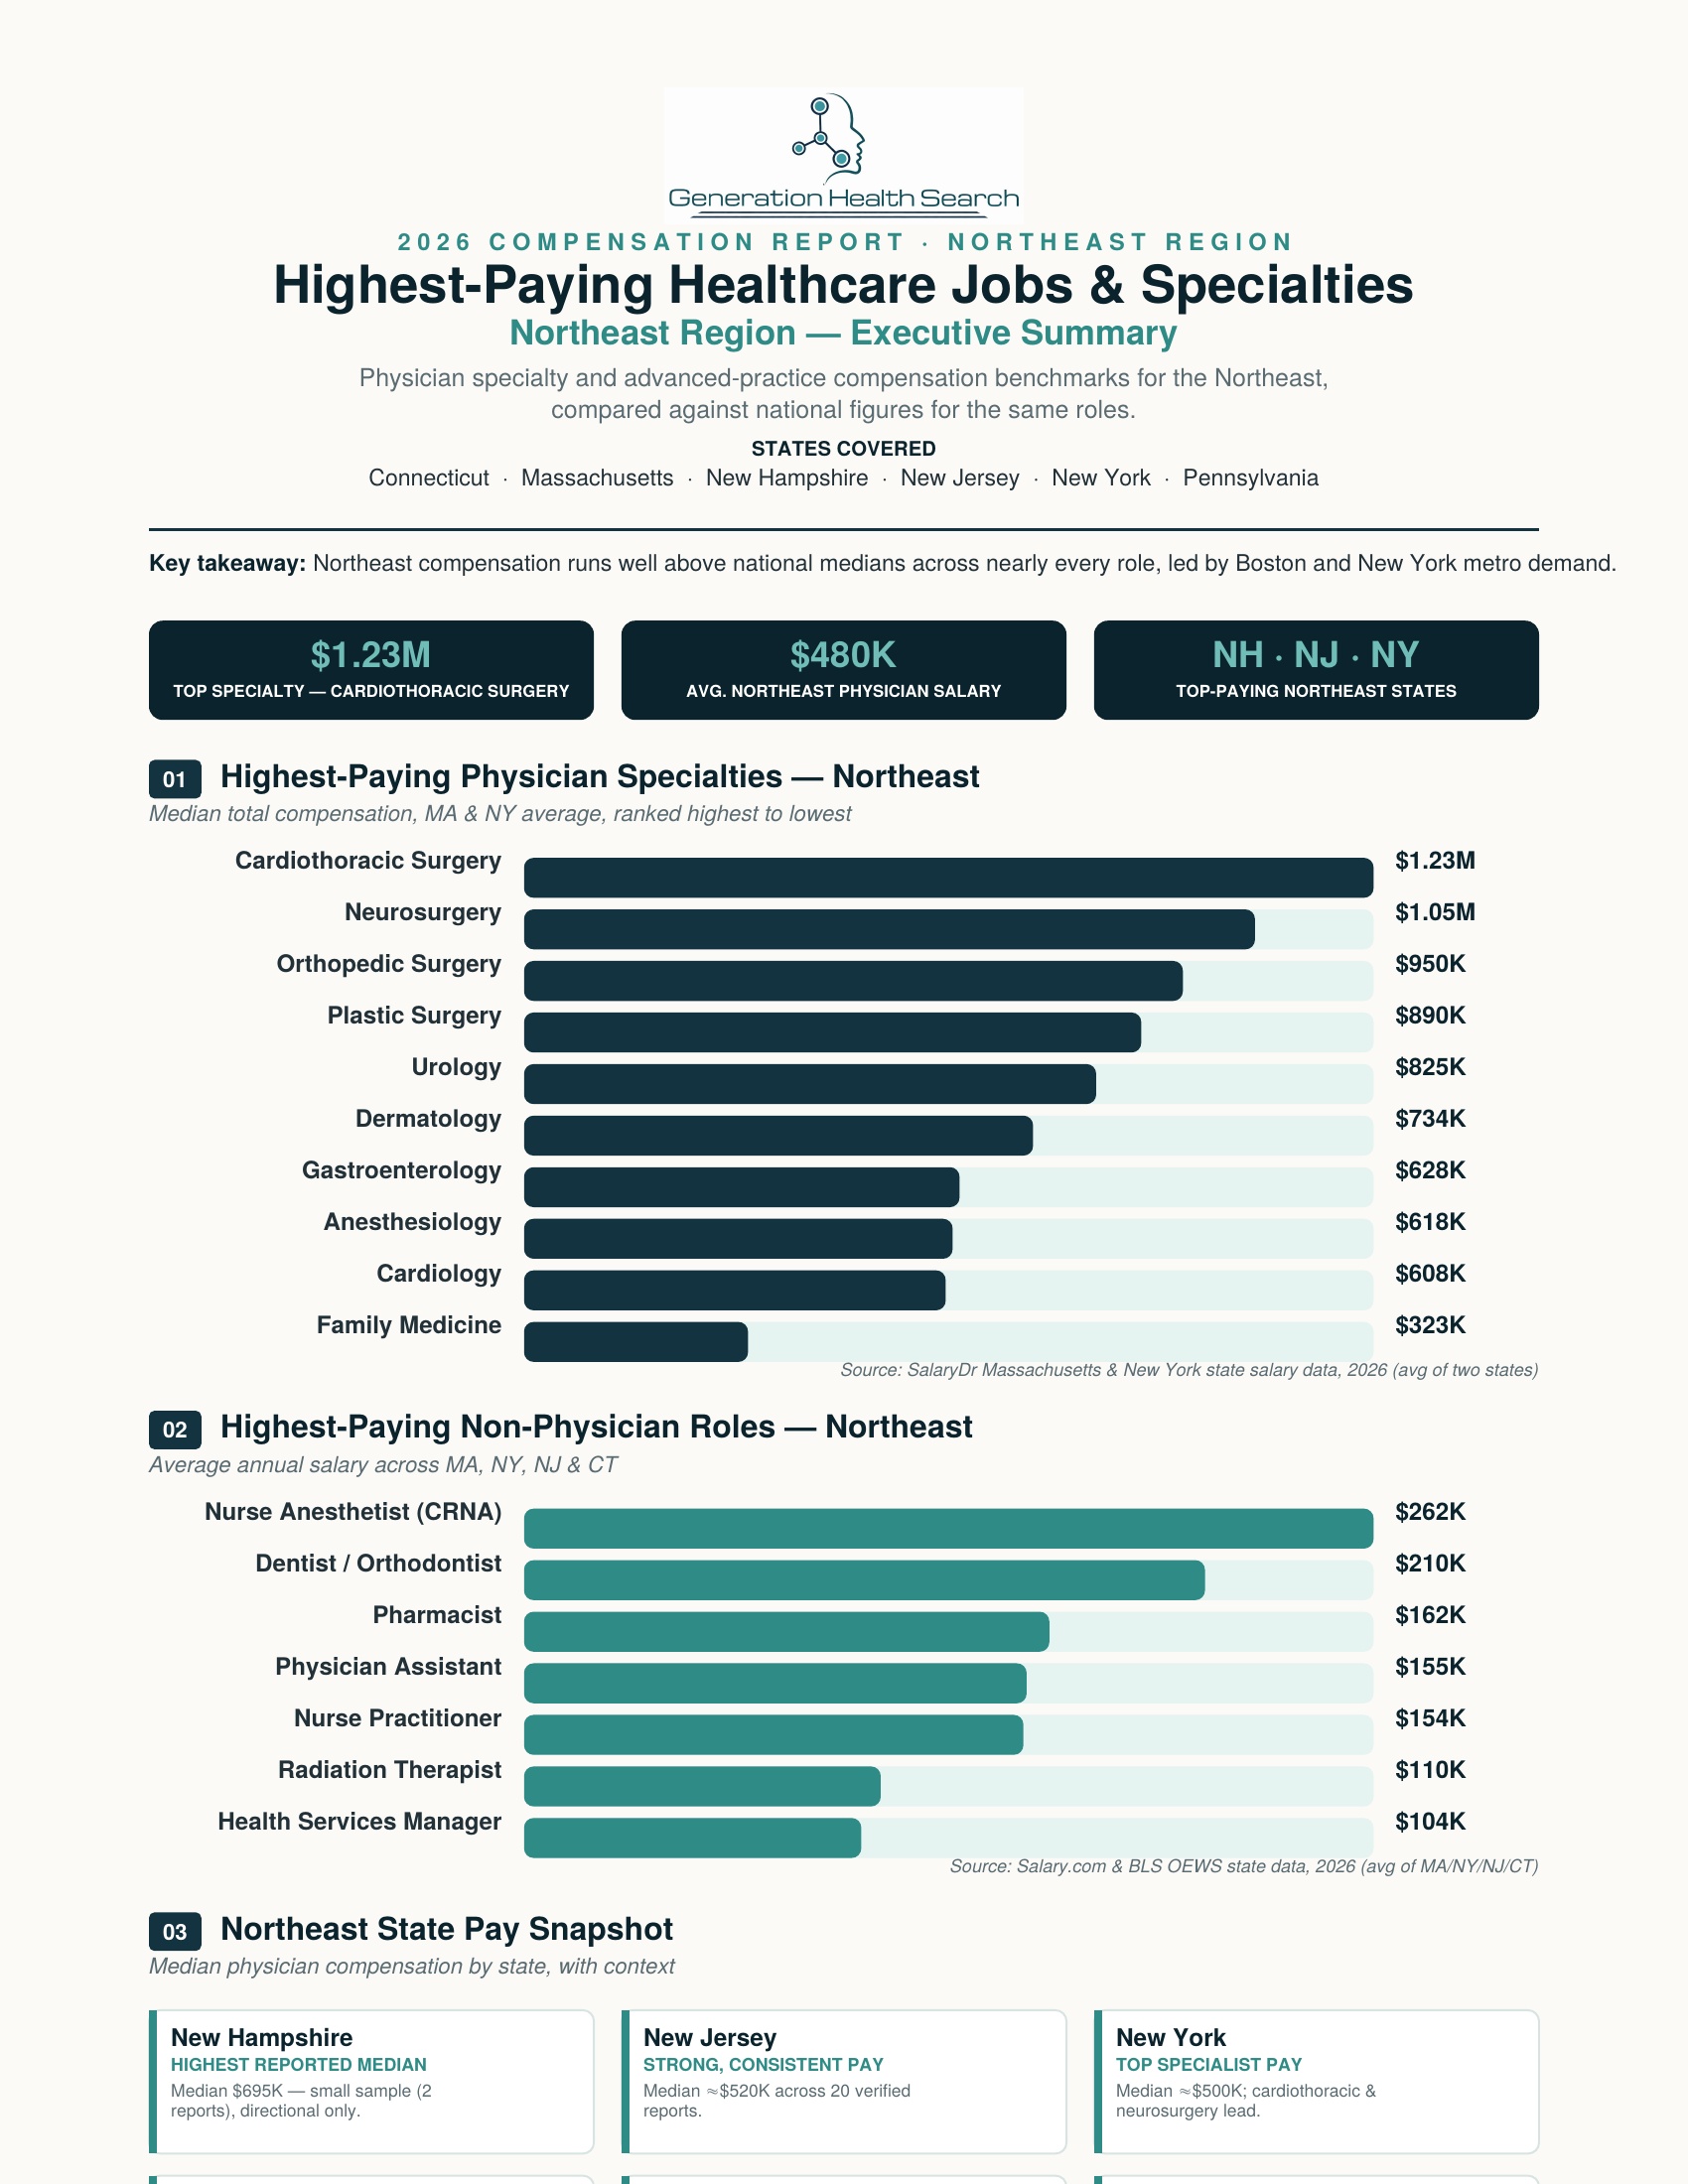
Explore Northeast compensation benchmarks for physicians, advanced practice providers and nurses, alongside specialty recruitment and primary care workforce reports.
This collection brings together Generation Health Search's Northeast salary and recruitment resources across specialties. Review the salary infographics, specialty workforce breakdowns and primary care briefing below.
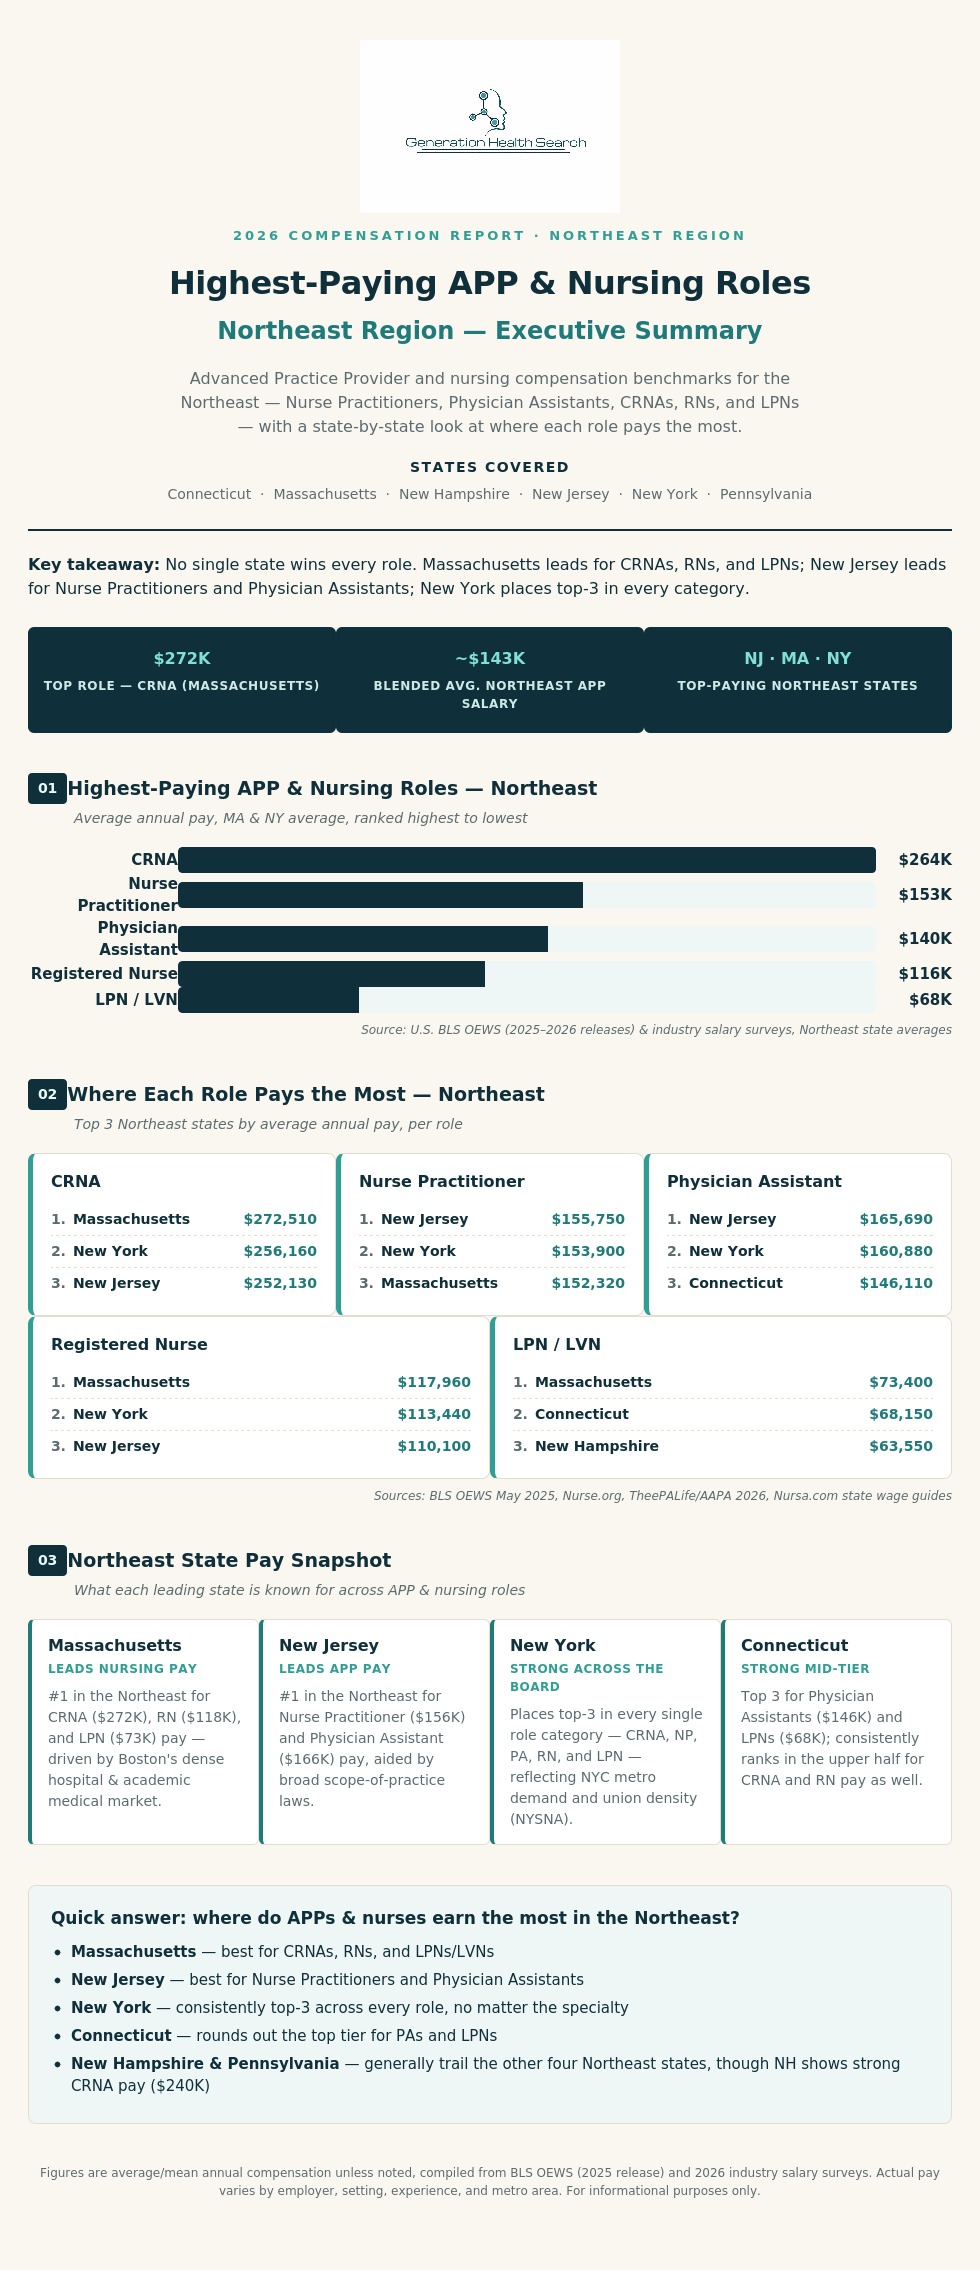
APP and nursing compensation Massachusetts leads the report's Northeast pay rankings for CRNAs, registered nurses and LPNs/LVNs. New Jersey leads for nurse practitioners and physician assistants. New York ranks in the top three across every role covered. These are average annual compensation benchmarks, not guaranteed offers; experience, setting and location affect actual pay.
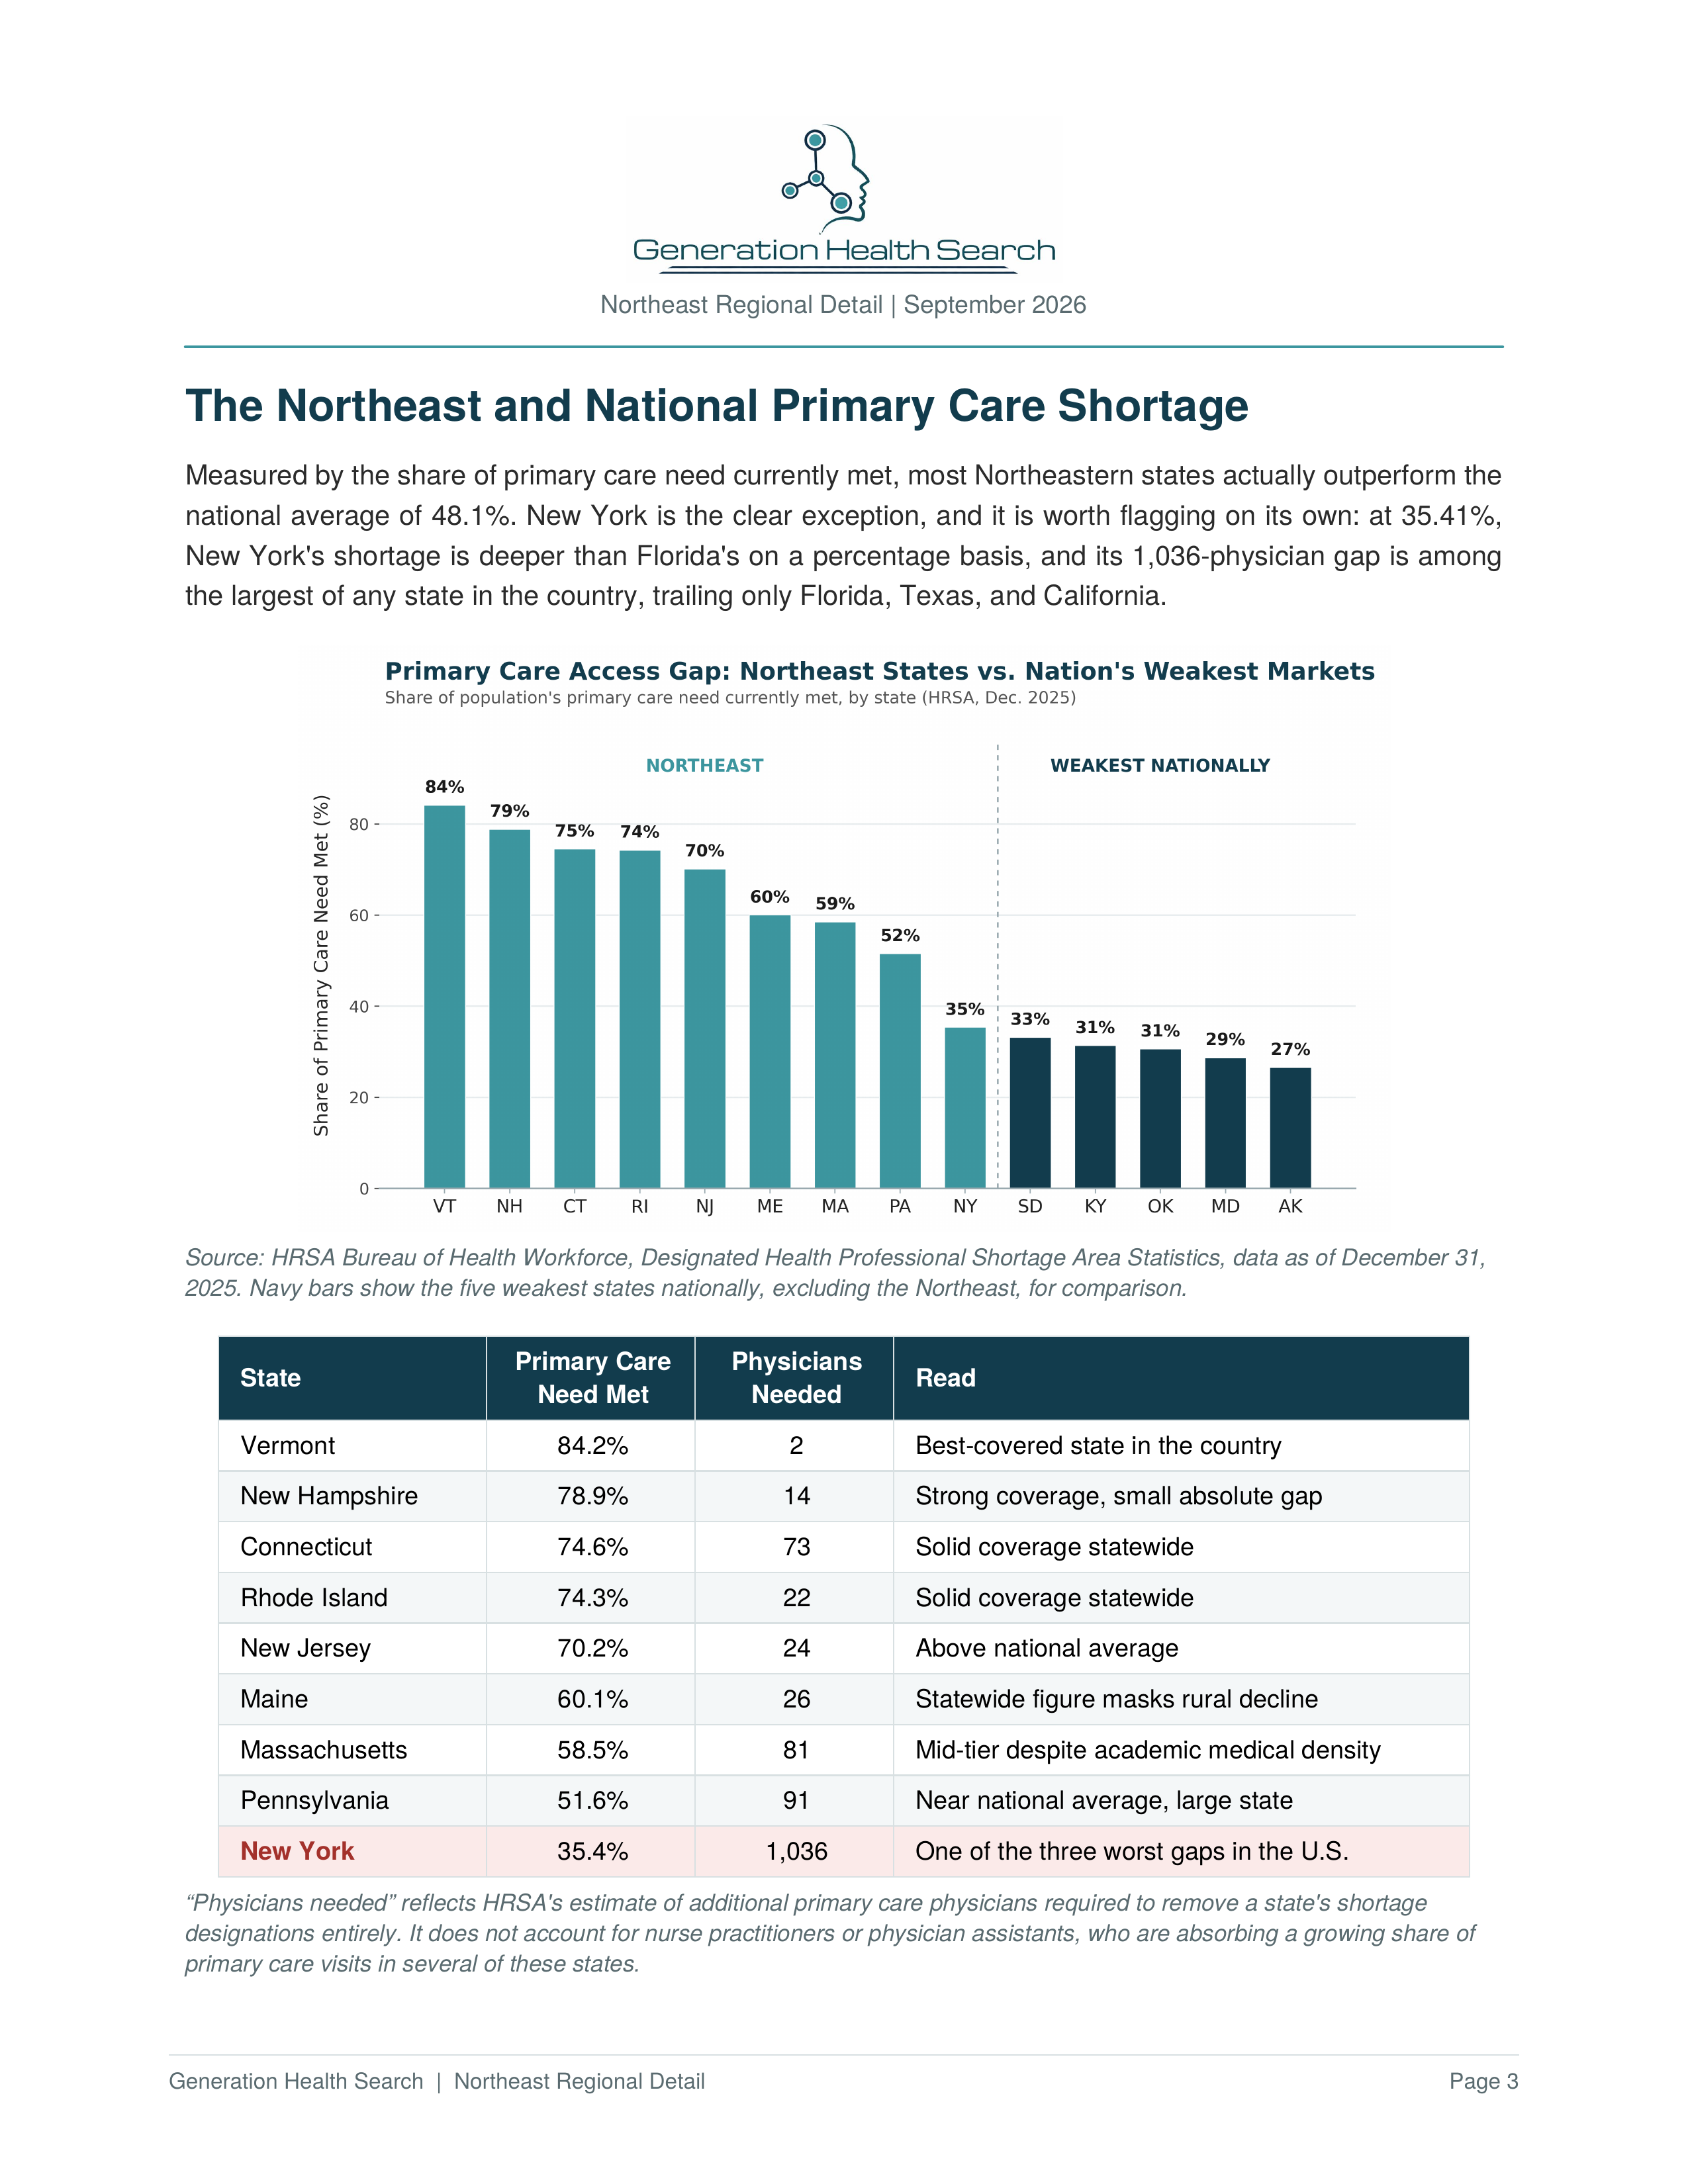
Primary care recruitment The state breakdown measures the share of primary care need currently met, rather than the number of physicians per resident. New York stands out at approximately 35.4% of need met and an estimated 1,036 additional physicians needed. Vermont, New Hampshire and Connecticut have stronger statewide coverage in this measure. State averages can still conceal local access gaps.
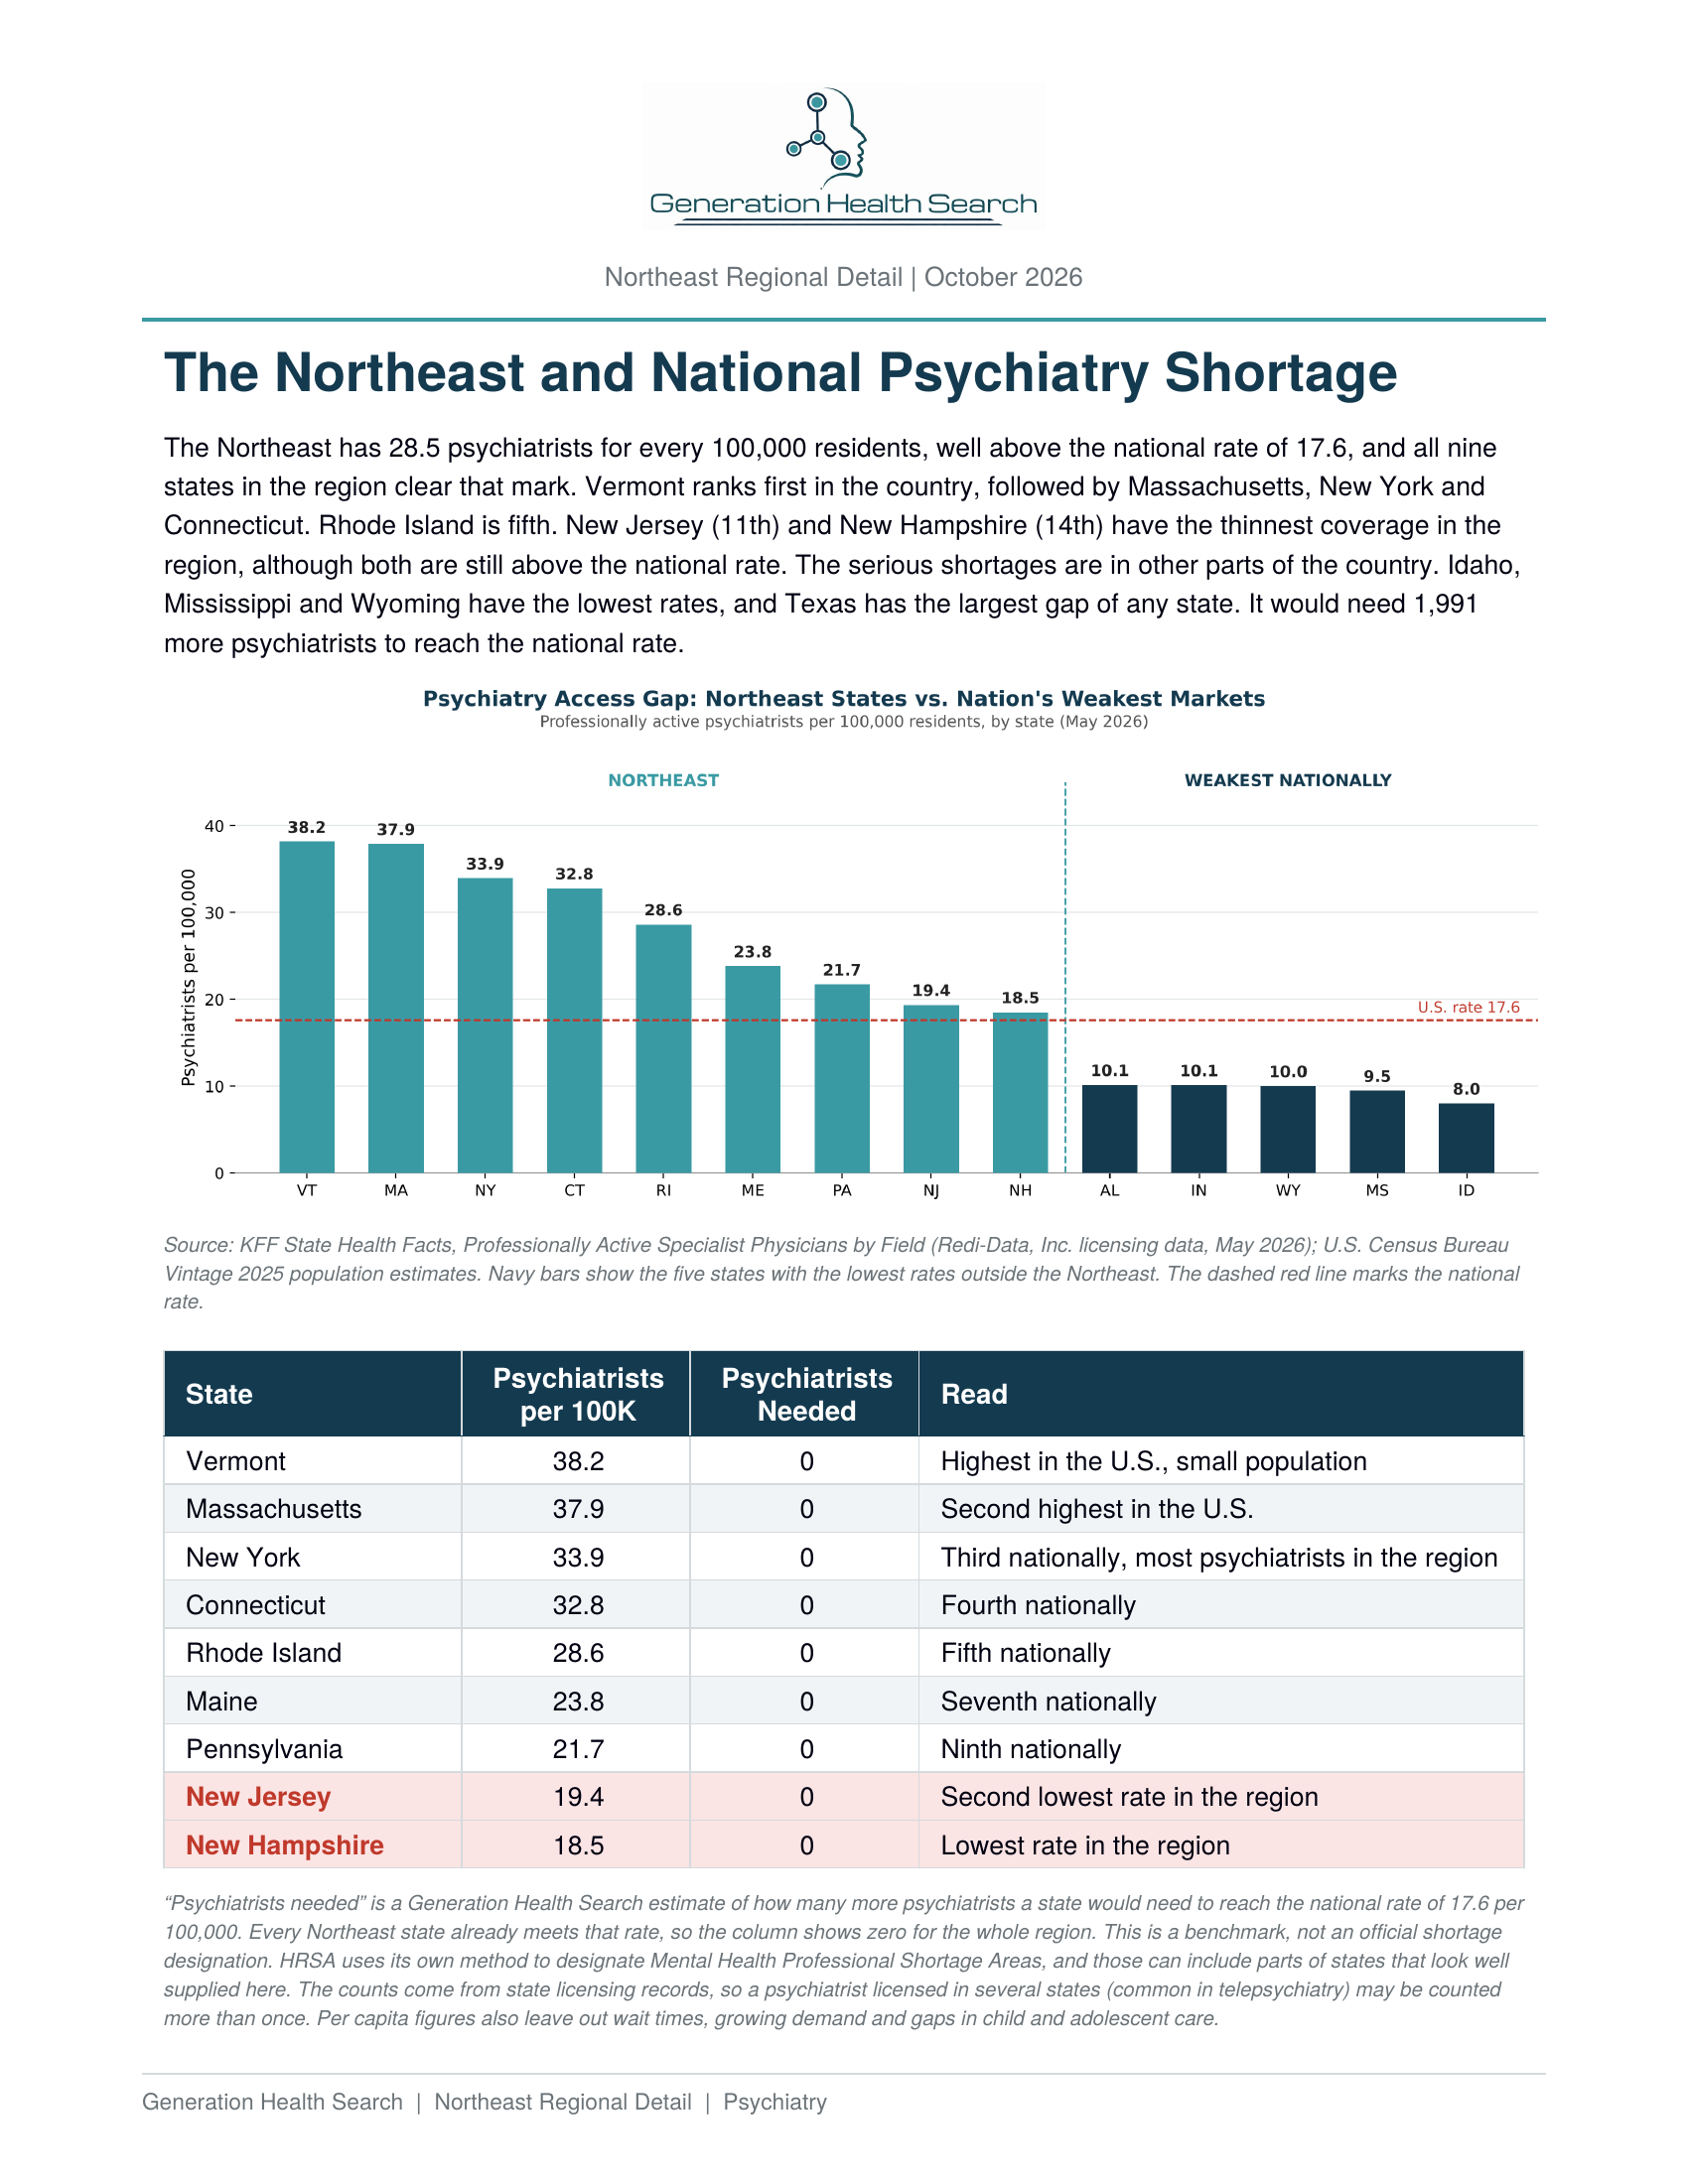
Psychiatry workforce The report places all nine Northeast states above the national benchmark of 17.6 psychiatrists per 100,000 residents. Vermont and Massachusetts have the highest rates in the region; New Jersey and New Hampshire have its lowest. A statewide rate does not establish appointment availability or eliminate shortages in child and adolescent care.
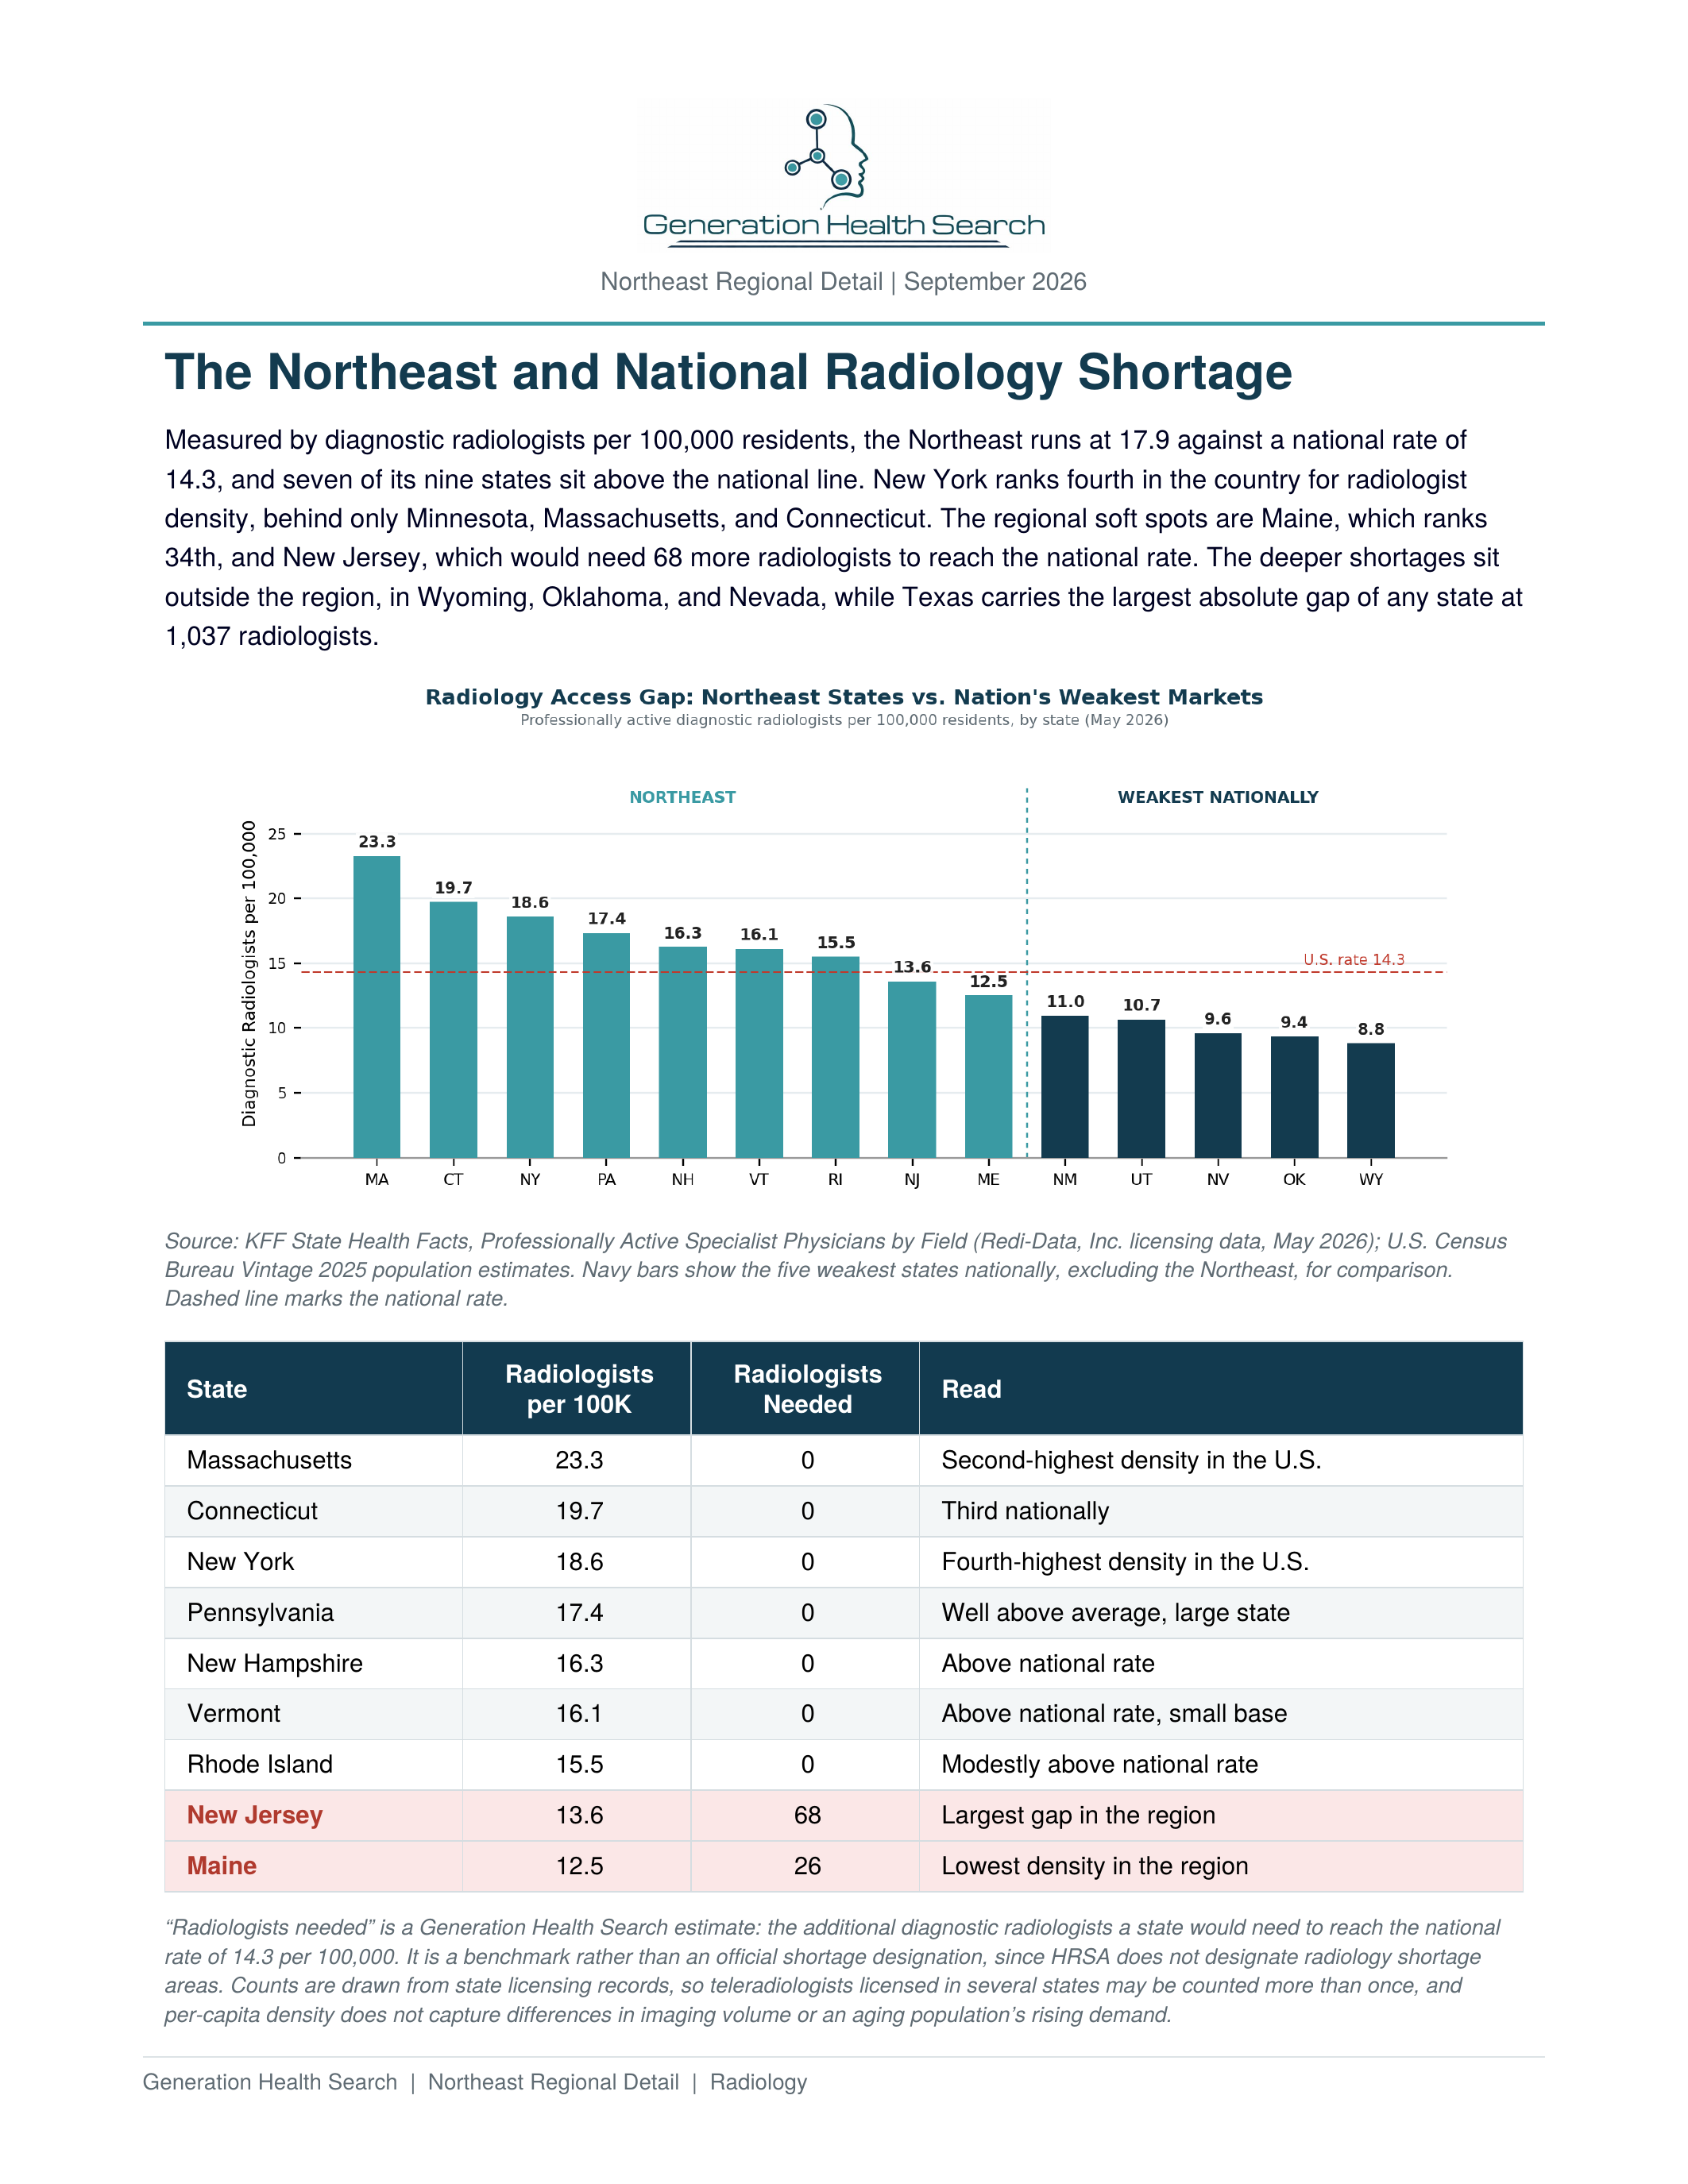
Radiology workforce Massachusetts, Connecticut and New York lead Northeast diagnostic radiologist density. New Jersey and Maine fall below the report's national benchmark of 14.3 per 100,000 residents. The report estimates gaps of 68 and 26 radiologists respectively to reach that benchmark; these are estimates, not official shortage designations.
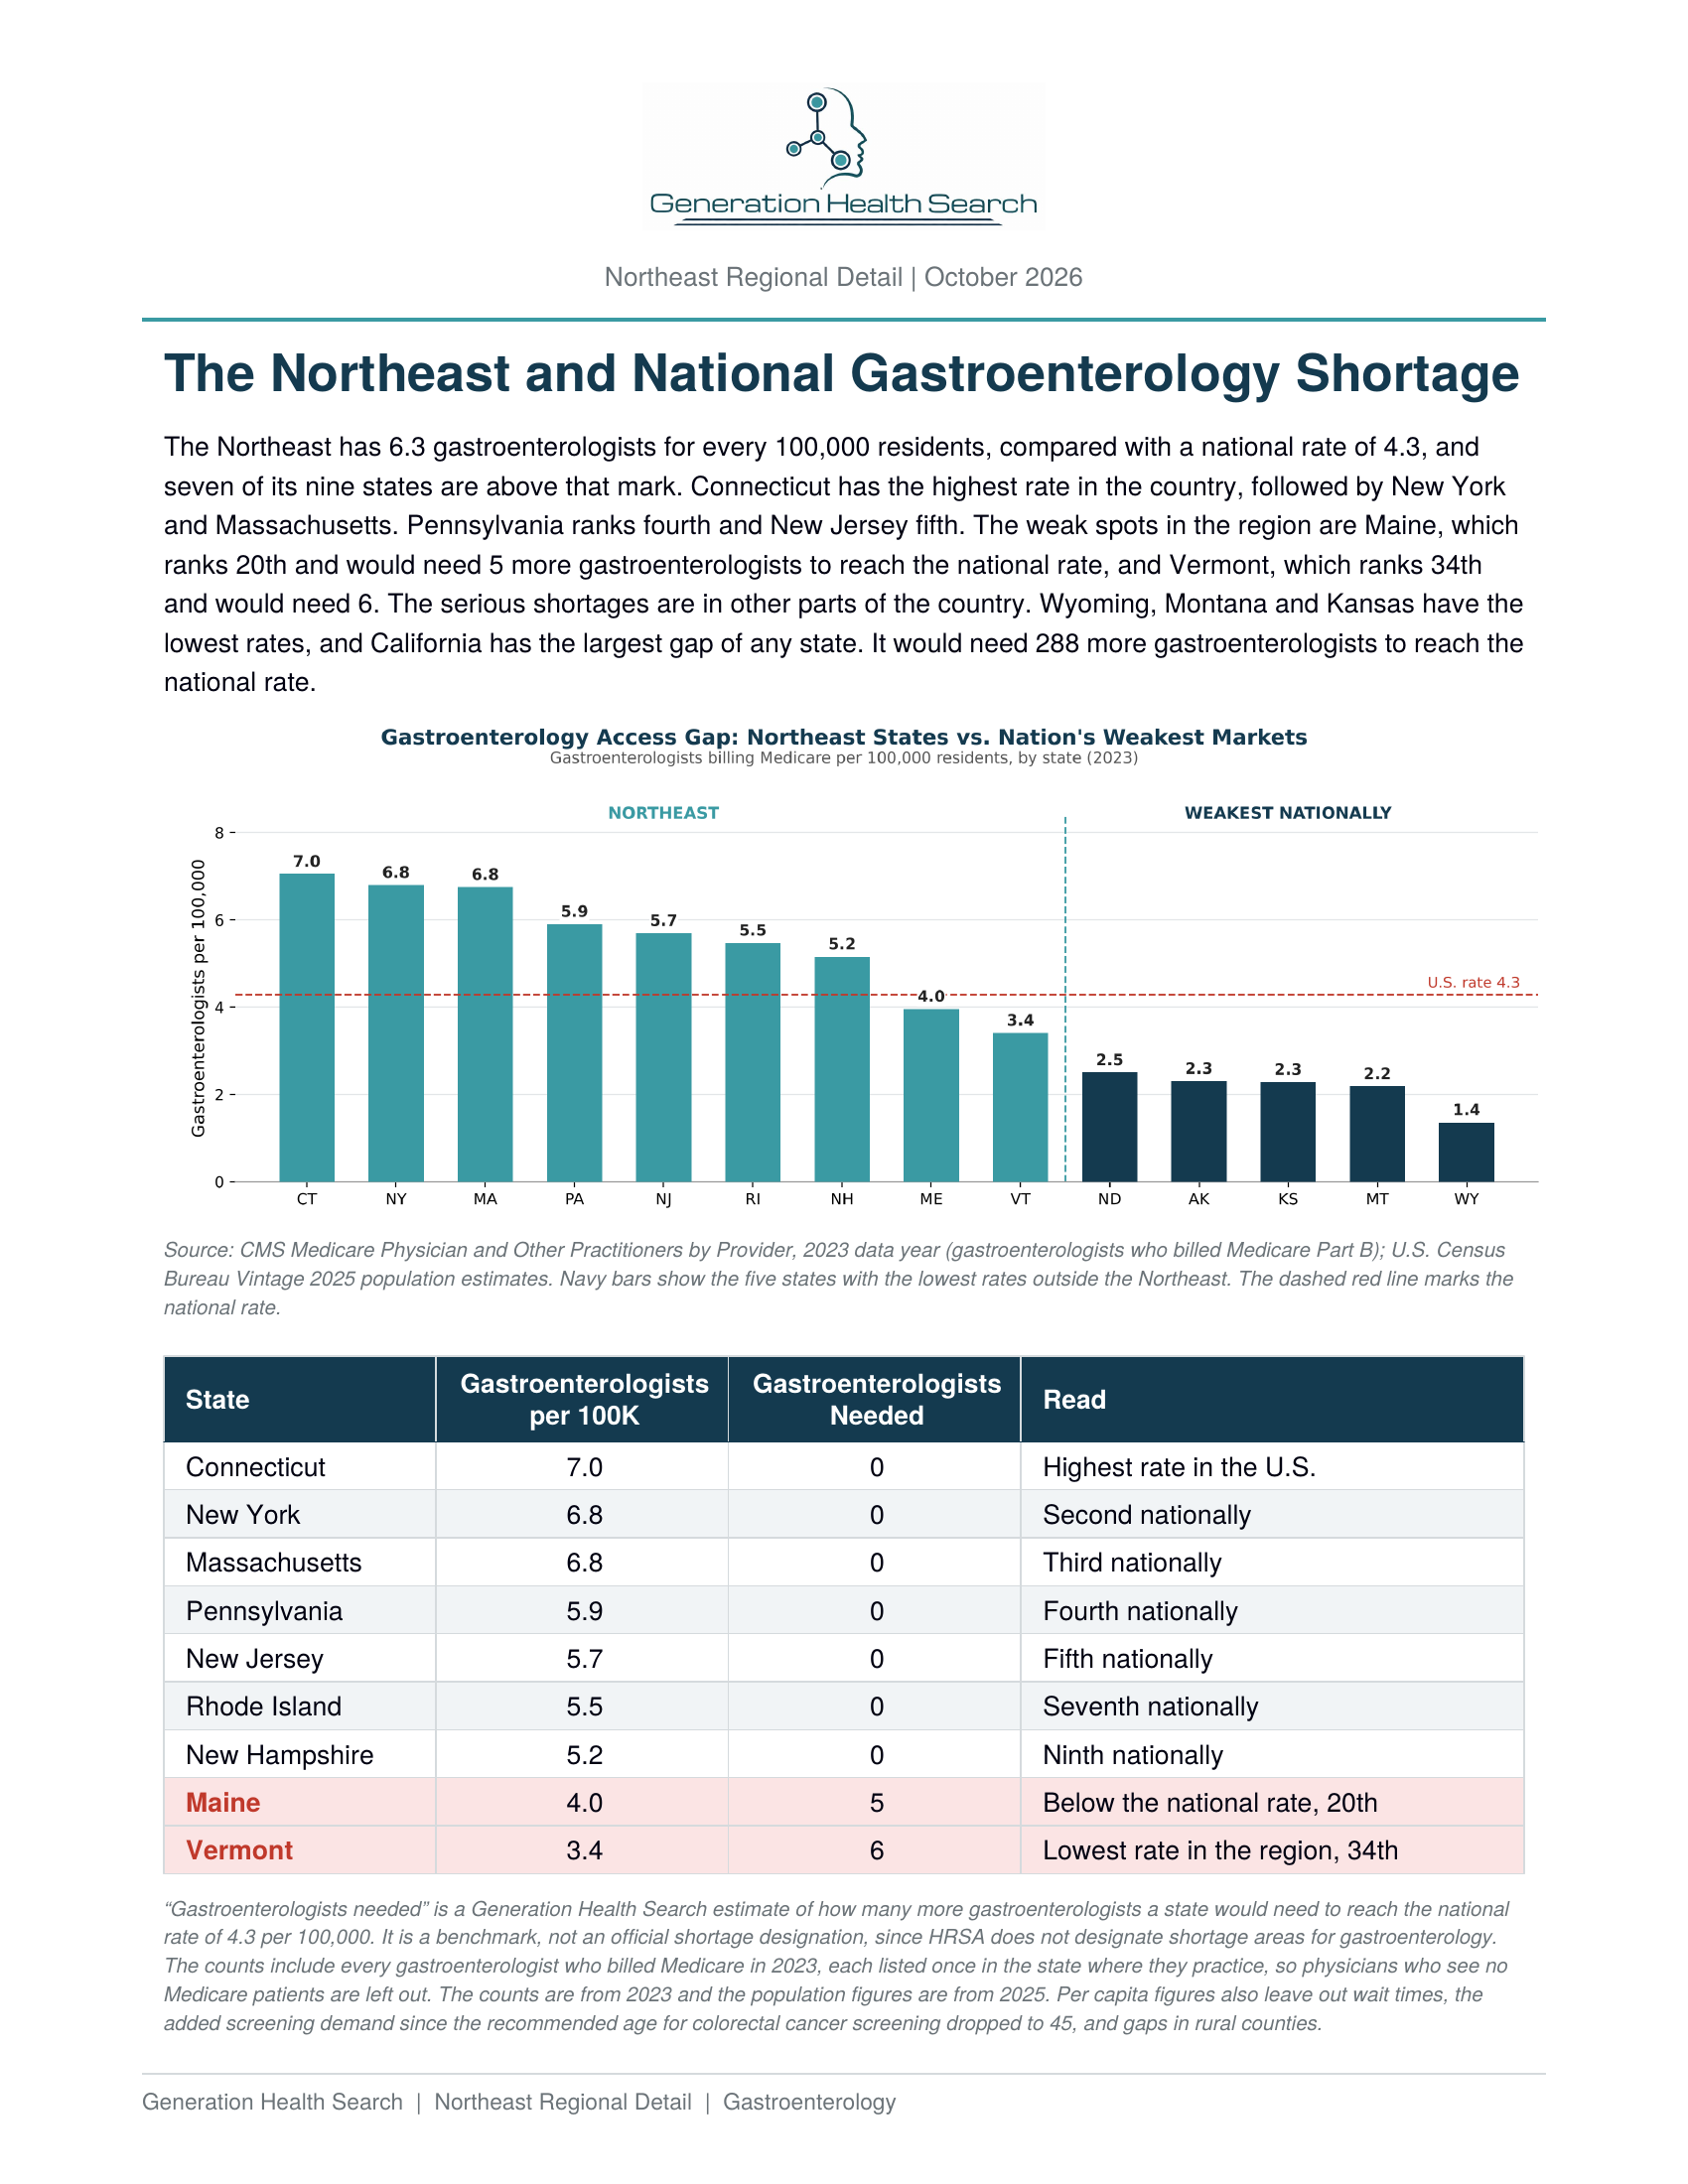
Gastroenterology workforce Connecticut, New York and Massachusetts lead the Northeast density figures. Maine and Vermont fall below the national benchmark of 4.3 Medicare-billing gastroenterologists per 100,000 residents. Medicare billing data and licensing data measure different populations and should not be treated as interchangeable.
Sources and limitations The attached reports cite BLS compensation data, CMS Medicare provider data, KFF State Health Facts, HRSA workforce statistics and Census population estimates. Each report identifies its source periods and methodology. Workforce ratios are not vacancy counts and may not capture rural access, wait times, part-time work or clinicians licensed in multiple states. Salary benchmarks and workforce measures use different reporting periods. This collection was published on October 16, 2026; original report dates have been preserved.